The Paradigm Shift
For decades, we were told that Insulin Resistance was simply a "broken receptor"—a malfunctioning lock on the cell door that refused to let fuel in.
The prescription? Push harder. Pump more insulin. Force the door open.
But that model is wrong.
The Overflow Hypothesis
The cell is not broken. The cell is protecting itself.
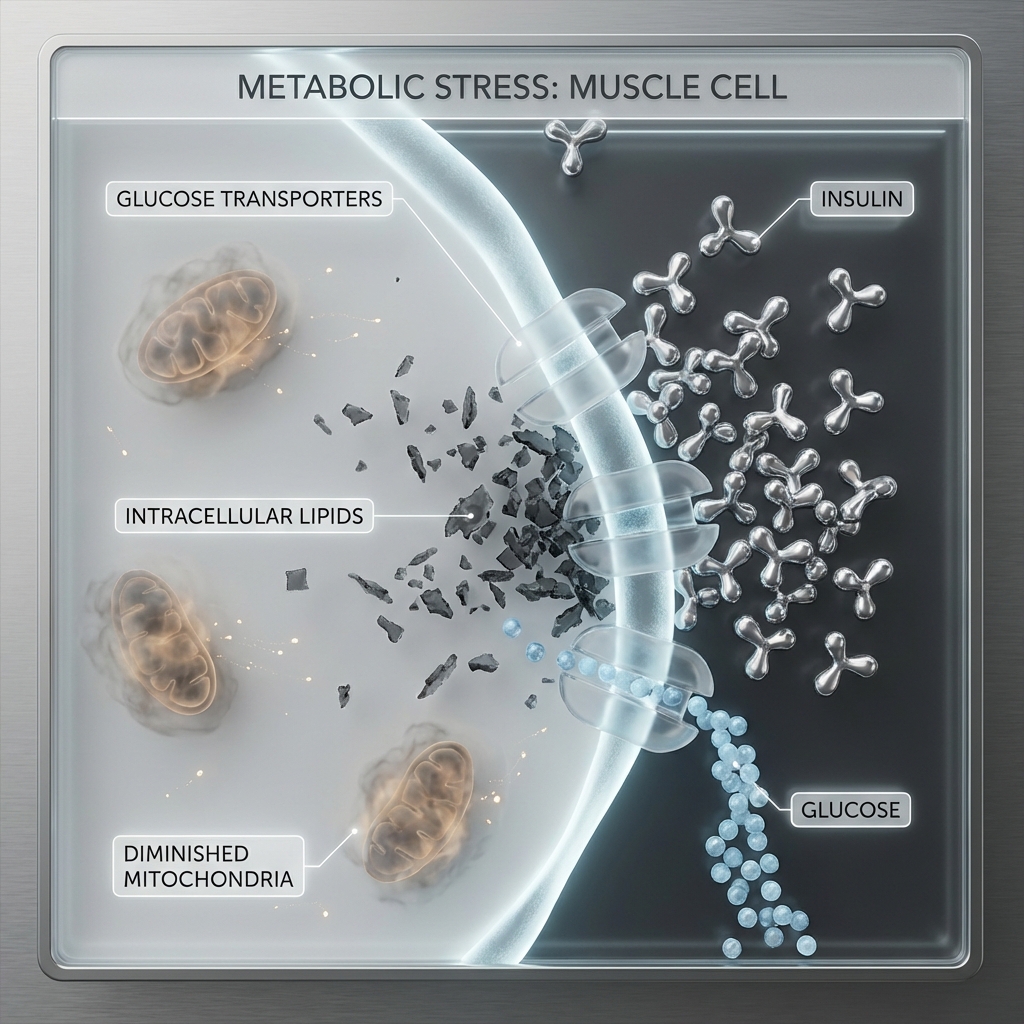
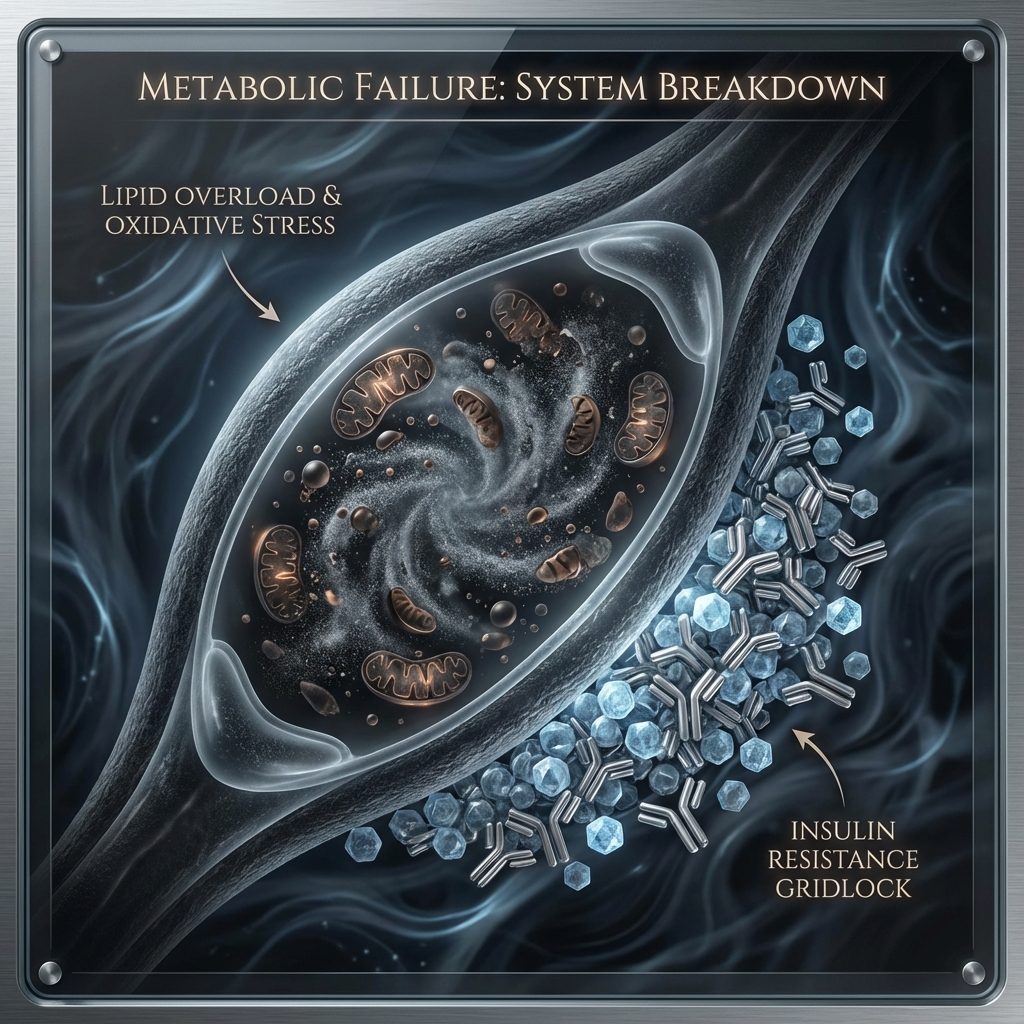
The real problem is Ectopic Lipid Accumulation—fat deposited where it doesn't belong. Inside muscle cells. Inside liver cells. Inside the very machinery responsible for burning fuel.
When the cell's energy factories (mitochondria) are clogged with "soot" (reactive oxygen species) and backlogged fuel (lipids), the cell locks the doors to prevent an internal explosion.
The Foreman and the Factory
Imagine a factory floor:
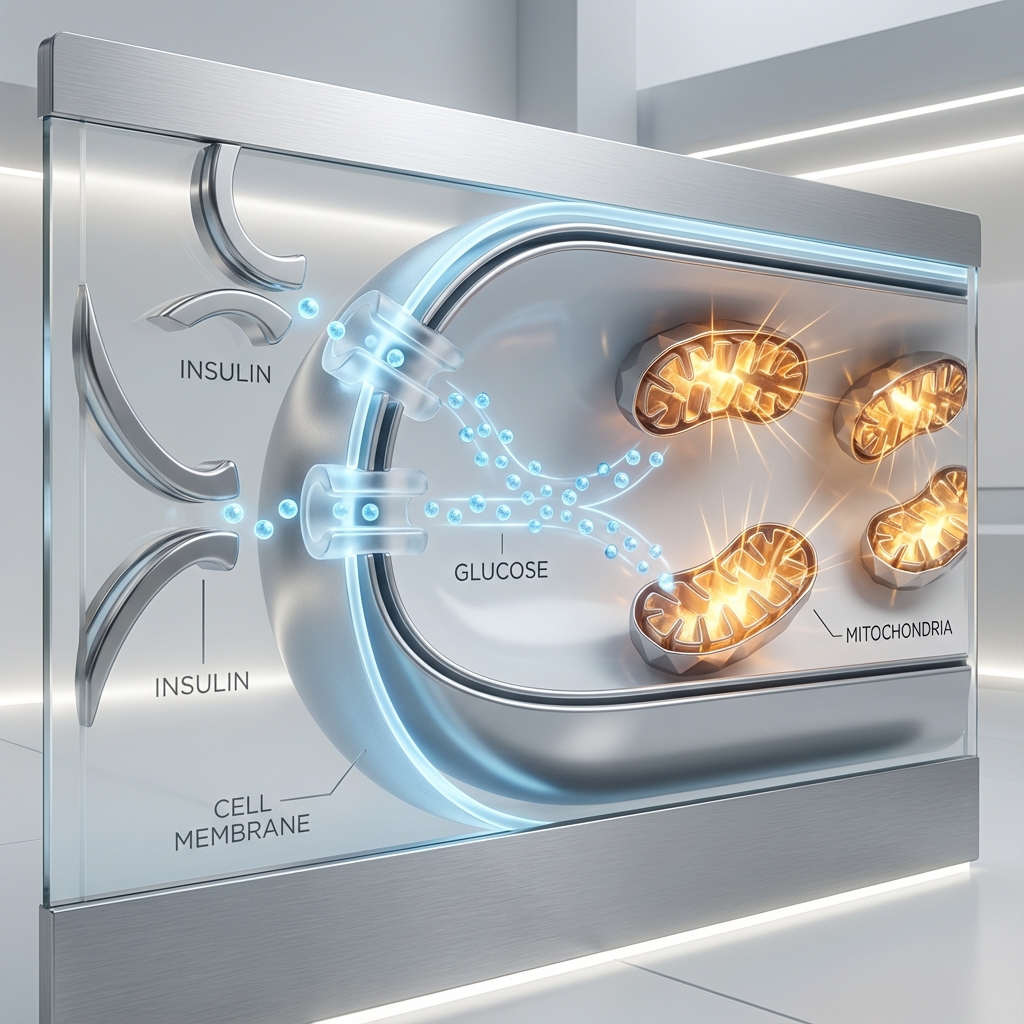
- Insulin is the Foreman, trying to push fuel (glucose) into the Cell (the Factory).
- The Mitochondria are the Machinery, responsible for burning that fuel cleanly and efficiently.
- But the Machinery is clogged with soot (ROS/Free Radicals) and backlogged with unprocessed fuel (lipids).
- The Factory locks the doors to prevent overload and combustion.
- The Foreman yells louder—the Pancreas pumps more Insulin.
The result? Hyperinsulinemia—chronically elevated insulin levels, even when blood glucose appears "normal."
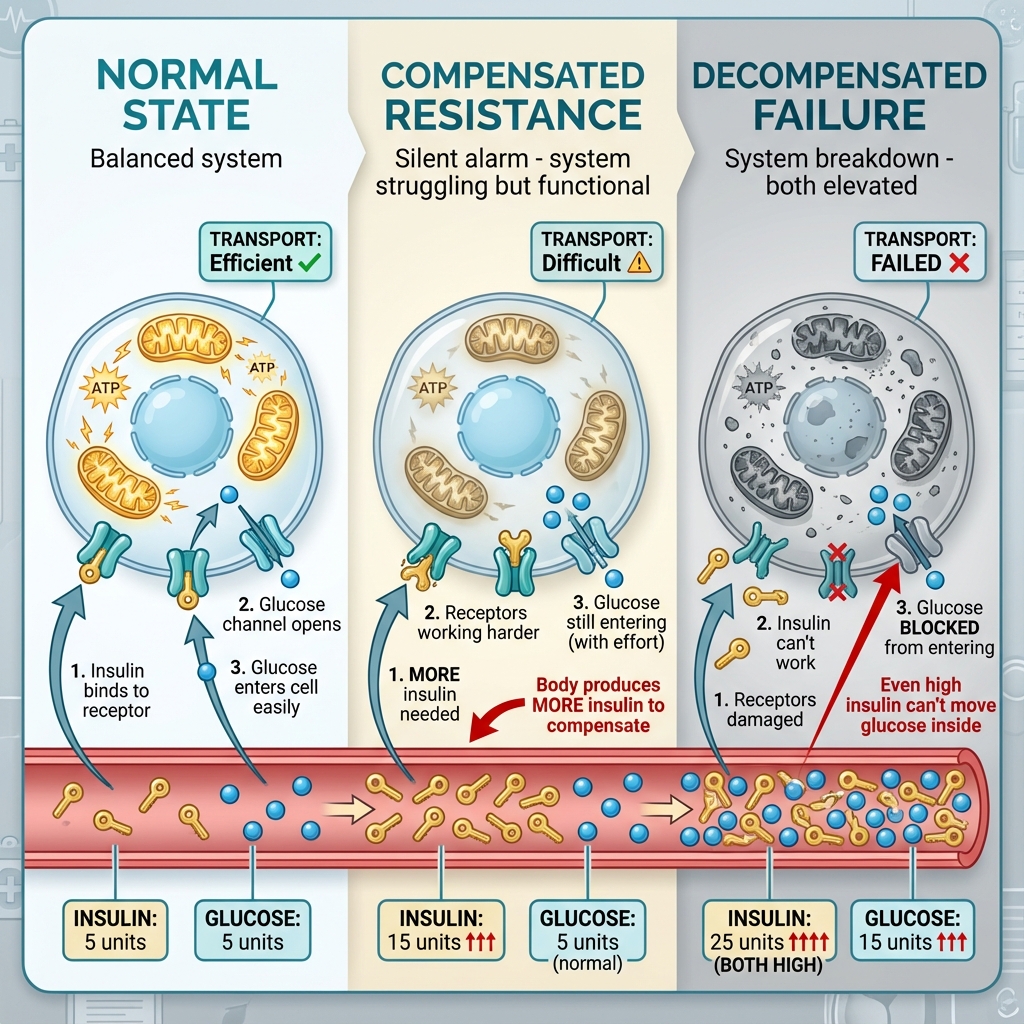
Figure 1: The Progressive Failure of Insulin Signaling. Note how insulin levels escalate (5 → 15 → 25 units) while glucose transport efficiency degrades. The middle "Compensated" stage shows normal blood glucose despite elevated insulin: the hidden metabolic alarm most doctors miss.
The Three Stages of Metabolic Decline
Metabolic disease is not a light switch. It is a slow dimmer, degrading over years, often decades, before symptoms appear.3
The Double Threat
Most people think the only problem is high blood sugar. But there are two toxins circulating in insulin resistance:
The Hidden Driver
High insulin itself can be harmful—even if glucose is normal.
Damage:
- Vascular stiffening → High BP6
- Cancer growth signaling (mTOR, IGF-1)7,8
- Brain inflammation → Alzheimer's9
- Hormonal disruption (PCOS, low testosterone)10
The Visible Damage
High glucose "caramelizes" tissues through glycation.
Damage:
- AGEs (Advanced Glycation End-products)11
- Skin ageing (wrinkles, loss of elasticity)12
- Organ brittleness (kidneys, nerves, eyes)
- Accelerated cellular ageing
Think of it like crème brûlée: sugar hardens tissues, making them stiff and dysfunctional.
The worst case? Both are elevated simultaneously.
This represents a significant combined metabolic risk that many people may be living with unknowingly.
The "Smart Ageing" Protocol
The question is not whether metabolic health matters. The question is where you currently sit on the spectrum—and whether you will take proactive steps.
Zone 2 Training
Build more "factories" (Mitochondrial Biogenesis).
Protocol: 45-60 minutes of low-intensity cardio at 60-70% max heart rate, 3-5x/week. This signals your cells to build new, clean mitochondria.
Time-Restricted Eating
Allow the factory to clear the backlog of "dirt and grit."
Protocol: Compress your eating window to 8-10 hours. This gives your cells 14-16 hours of autophagy—the cellular "self-cleaning" process.
Targeted Supplements
Support mitochondrial health and insulin sensitivity.
- Berberine: AMPK activator (dosage as per clinical guidance)
- Alpha Lipoic Acid: Mitochondrial antioxidant (dosage as per clinical guidance)
Stop Guessing. Start Measuring.
Consider discussing a Fasting Insulin test with your healthcare provider, not just an HbA1c.
Proactive assessment may begin before glucose levels change.
Scientific References
- Petersen KF, Shulman GI. Etiology of insulin resistance. Am J Med. 2006;119(5 Suppl 1):S10-6. doi:10.1016/j.amjmed.2006.01.009
- Shulman GI. Ectopic fat in insulin resistance, dyslipidemia, and cardiometabolic disease. N Engl J Med. 2014;371(12):1131-41. doi:10.1056/NEJMra1011035
- Weir GC, Bonner-Weir S. Five stages of evolving beta-cell dysfunction during progression to diabetes. Diabetes. 2004;53 Suppl 3:S16-21. doi:10.2337/diabetes.53.suppl_3.s16
- Kraft JR. Diabetes Epidemic & You: Should Everyone Be Tested? Trafford Publishing; 2008. [Landmark analysis of ~14,500 patients demonstrating hyperinsulinemia decades before glucose abnormalities]
- Tabák AG, Jokela M, Akbaraly TN, Brunner EJ, Kivimäki M, Witte DR. Trajectories of glycaemia, insulin sensitivity, and insulin secretion before diagnosis of type 2 diabetes: an analysis from the Whitehall II study. Lancet. 2009;373(9682):2215-21. doi:10.1016/ S0140-6736(09)60619-X
- Muris DM, Houben AJ, Schram MT, Stehouwer CD. Microvascular dysfunction is associated with a higher incidence of type 2 diabetes mellitus: a systematic review and meta-analysis. Arterioscler Thromb Vasc Biol. 2012;32(12):3082-94. doi:10.1161/ATVBAHA.112.300291
- Arcidiacono B, Iiritano S, Nocera A, et al. Insulin resistance and cancer risk: an overview of the pathogenetic mechanisms. Exp Diabetes Res. 2012;2012:789174. doi:10.1155/2012/789174
- Gallagher EJ, LeRoith D. Obesity and diabetes: the increased risk of cancer and cancer-related mortality. Physiol Rev. 2015;95(3):727-48. doi:10.1152/physrev.00030.2014
- De Felice FG, Ferreira ST. Inflammation, defective insulin signaling, and mitochondrial dysfunction as common molecular denominators connecting type 2 diabetes to Alzheimer disease. Diabetes. 2014;63(7):2262-72. doi:10.2337/db13-1954
- Diamanti-Kandarakis E, Dunaif A. Insulin resistance and the polycystic ovary syndrome revisited: an update on mechanisms and implications. Endocr Rev. 2012;33(6):981-1030. doi:10.1210/er.2011-1034
- Singh R, Barden A, Mori T, Beilin L. Advanced glycation end-products: a review. Diabetologia. 2001;44(2):129-46. doi:10.1007/s001250051591
- Pageon H, Asselineau D. An in vitro approach to the chronological ageing of skin by glycation of the collagen: the biological effect of glycation on the reconstructed skin model. Ann N Y Acad Sci. 2005;1043:529-32. doi:10.1196/annals.1333.060
Medical Disclaimer: This content is for educational purposes only and does not constitute medical advice. The research cited represents current scientific understanding as of publication. Individual responses to metabolic interventions vary. Always consult your healthcare provider before making changes to your health regimen.